Query fleet metrics
Query fleet metrics through the bundled Grafana, the fastest path once it's deployed, or directly against the Query Proxy's Prometheus-compatible HTTP API for automation and your own query clients. In both cases the Query Proxy authorizes each request with Platform, injects the requested scope into PromQL, and forwards the rewritten query to your metrics backend.
Deploy the bundled Grafana with Argo CD
Grafana is optional. Deploy it when you want the pre-provisioned fleet dashboards and
Platform-authenticated access. If you use the
Argo CD integration, reference the
fleet-observability-grafana ArgoCDApplicationTemplate.
- Platform UI
- YAML
Create the ArgoCDApplication object in your project namespace:
apiVersion: management.loft.sh/v1
kind: ArgoCDApplication
metadata:
  name: fleet-grafana
  namespace: p-my-project          # replace with your project namespace
spec:
  displayName: "Fleet Grafana"
  destination:
    cluster:
      name: loft-cluster           # the reserved name for Platform's local cluster; don't change this
  templateRef:
    name: fleet-observability-grafana
  parameters:
    destinationNamespace: vcluster-platform
    platformHost: platform.example.com
    project: default
Click Control Plane Clusters in the left sidebar under the infrastructure section, then click the local cluster (named
loft-clusterby default) to open its detail page.Select the ArgoCD Apps tab and click .
In the Basics section, enter a Display Name such as
Fleet Grafana.From the Argo CD Application Template dropdown, select the Fleet Observability: Grafana template.
Fill the Template Parameters. Set platformHost to your Platform host.
Click .
| Parameter | Default | Description |
|---|---|---|
destinationNamespace | vcluster-platform | Namespace for Grafana. |
project | default | Argo CD project that owns the application. |
platformHost | Platform host | Platform host used to authenticate Grafana users. |
grafanaAdminGroup | (empty) | Group mapped to the Grafana admin role. |
grafanaCertSecret | (empty) | TLS Secret for Grafana serving. When empty, Platform self-signs a Secret named grafana-server-tls. |
Configure the fleet observability connector so Platform can proxy and embed the bundled Grafana dashboards. These values match the template defaults:
stringData:
  grafanaUrl: https://grafana.vcluster-platform.svc.cluster.local
  grafanaCertSecretName: grafana-server-tls
  fleetObservabilityDashboardUid: vcluster-fleet-observability
If you change destinationNamespace, update grafanaUrl. If you supply
grafanaCertSecret, use that Secret name instead of grafana-server-tls.
Query with the bundled Grafana
Once deployed, Platform runs a bundled Grafana pre-equipped with fleet dashboards and scoped datasources. It is the fastest way to explore fleet metrics without writing PromQL by hand.
Sign in
The bundled Grafana is served at https://<platform-host>/grafana/ and reverse-proxied by
Platform. Sign in with Platform SSO; the local Grafana login form is disabled. Your Grafana
role follows your Platform group membership: members of the template's grafanaAdminGroup
get the Grafana Admin role, everyone else gets Viewer. The Grafana role governs Grafana
features, not which metrics you can read.
Dashboards
Three dashboards ship pre-provisioned:
| Dashboard | View |
|---|---|
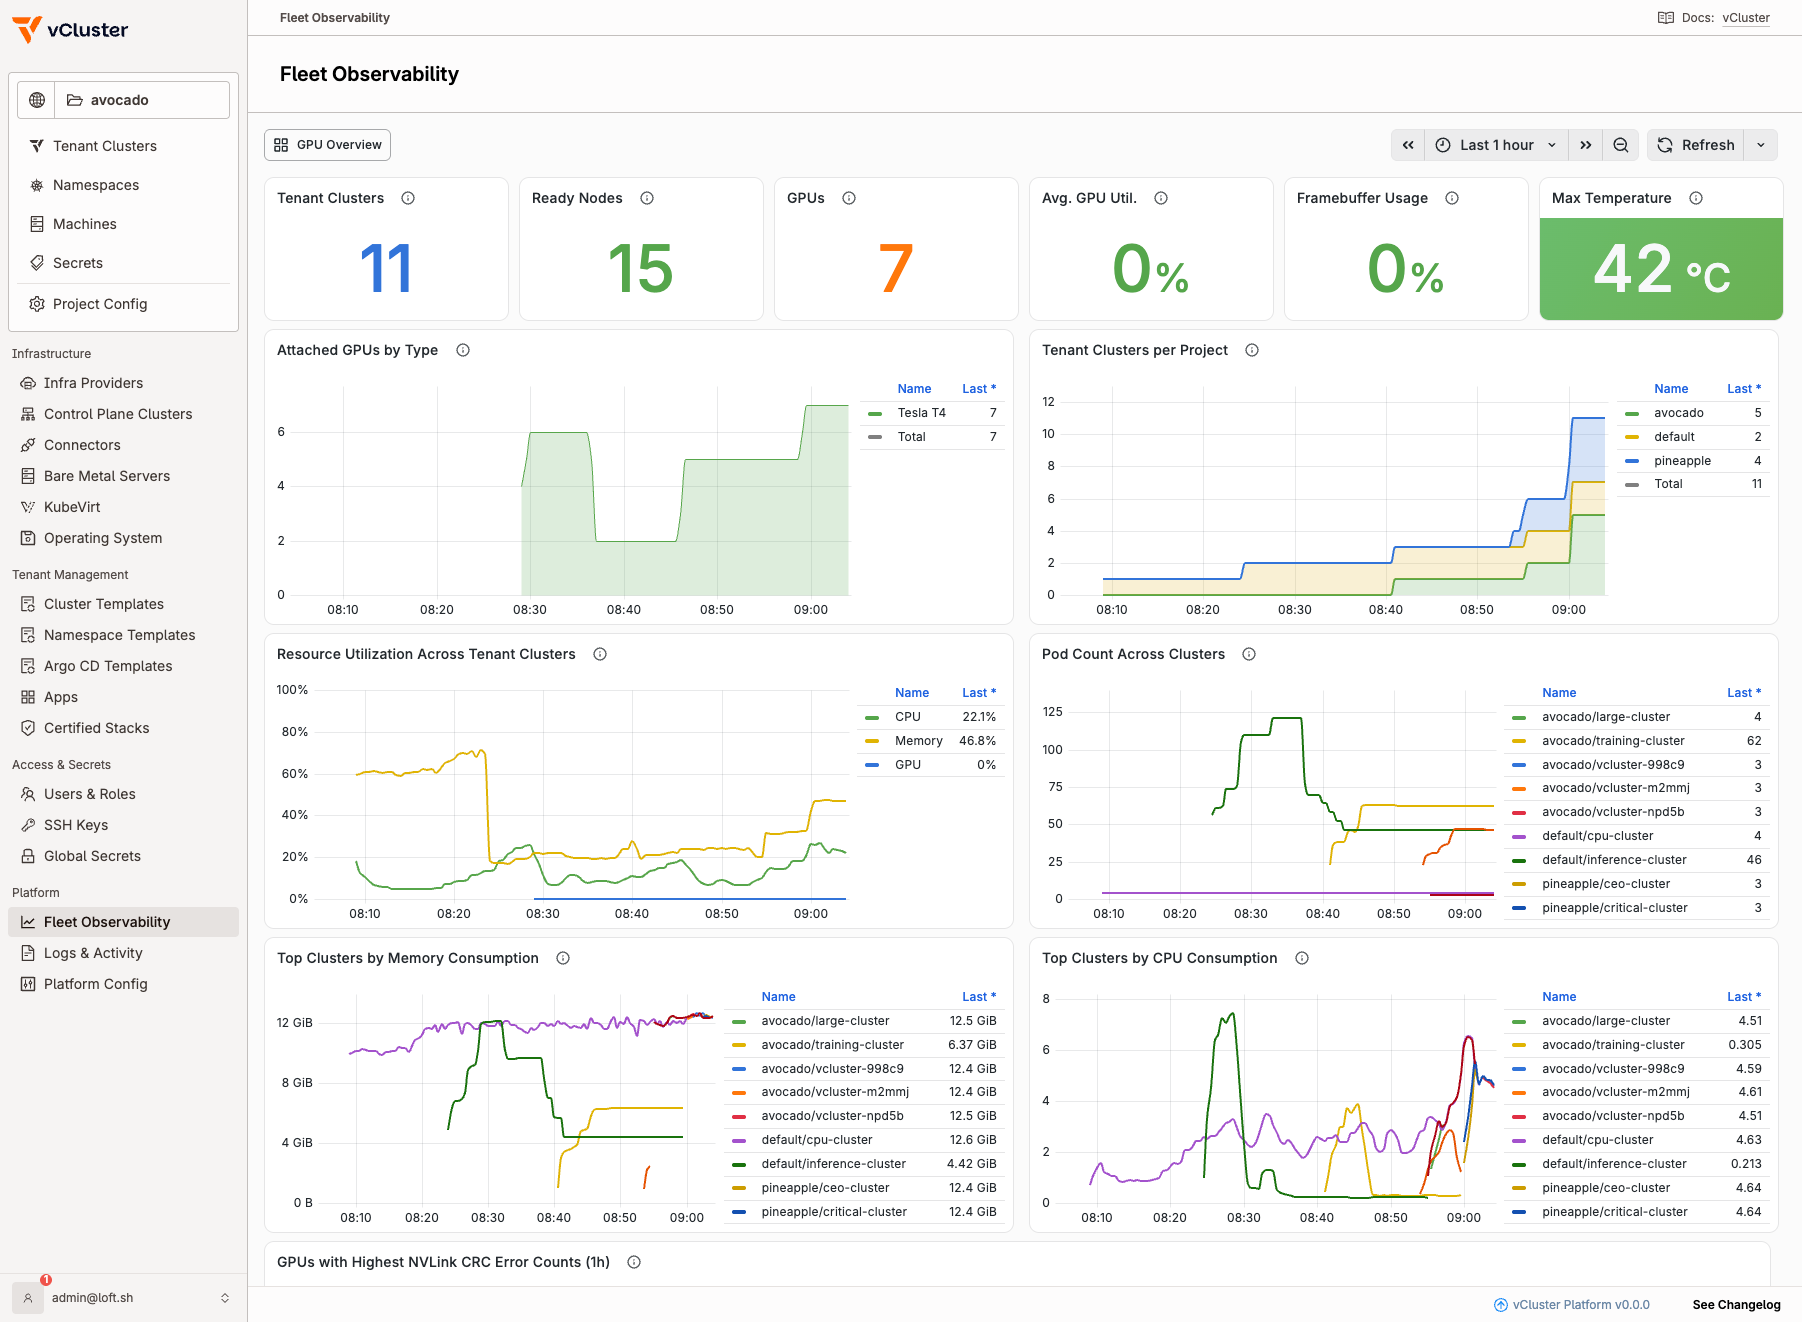
| Fleet Observability | Fleet-wide summary: tenant cluster counts, GPU inventory and utilization, hardware-error hotspots, and per-tenant scrape health. |
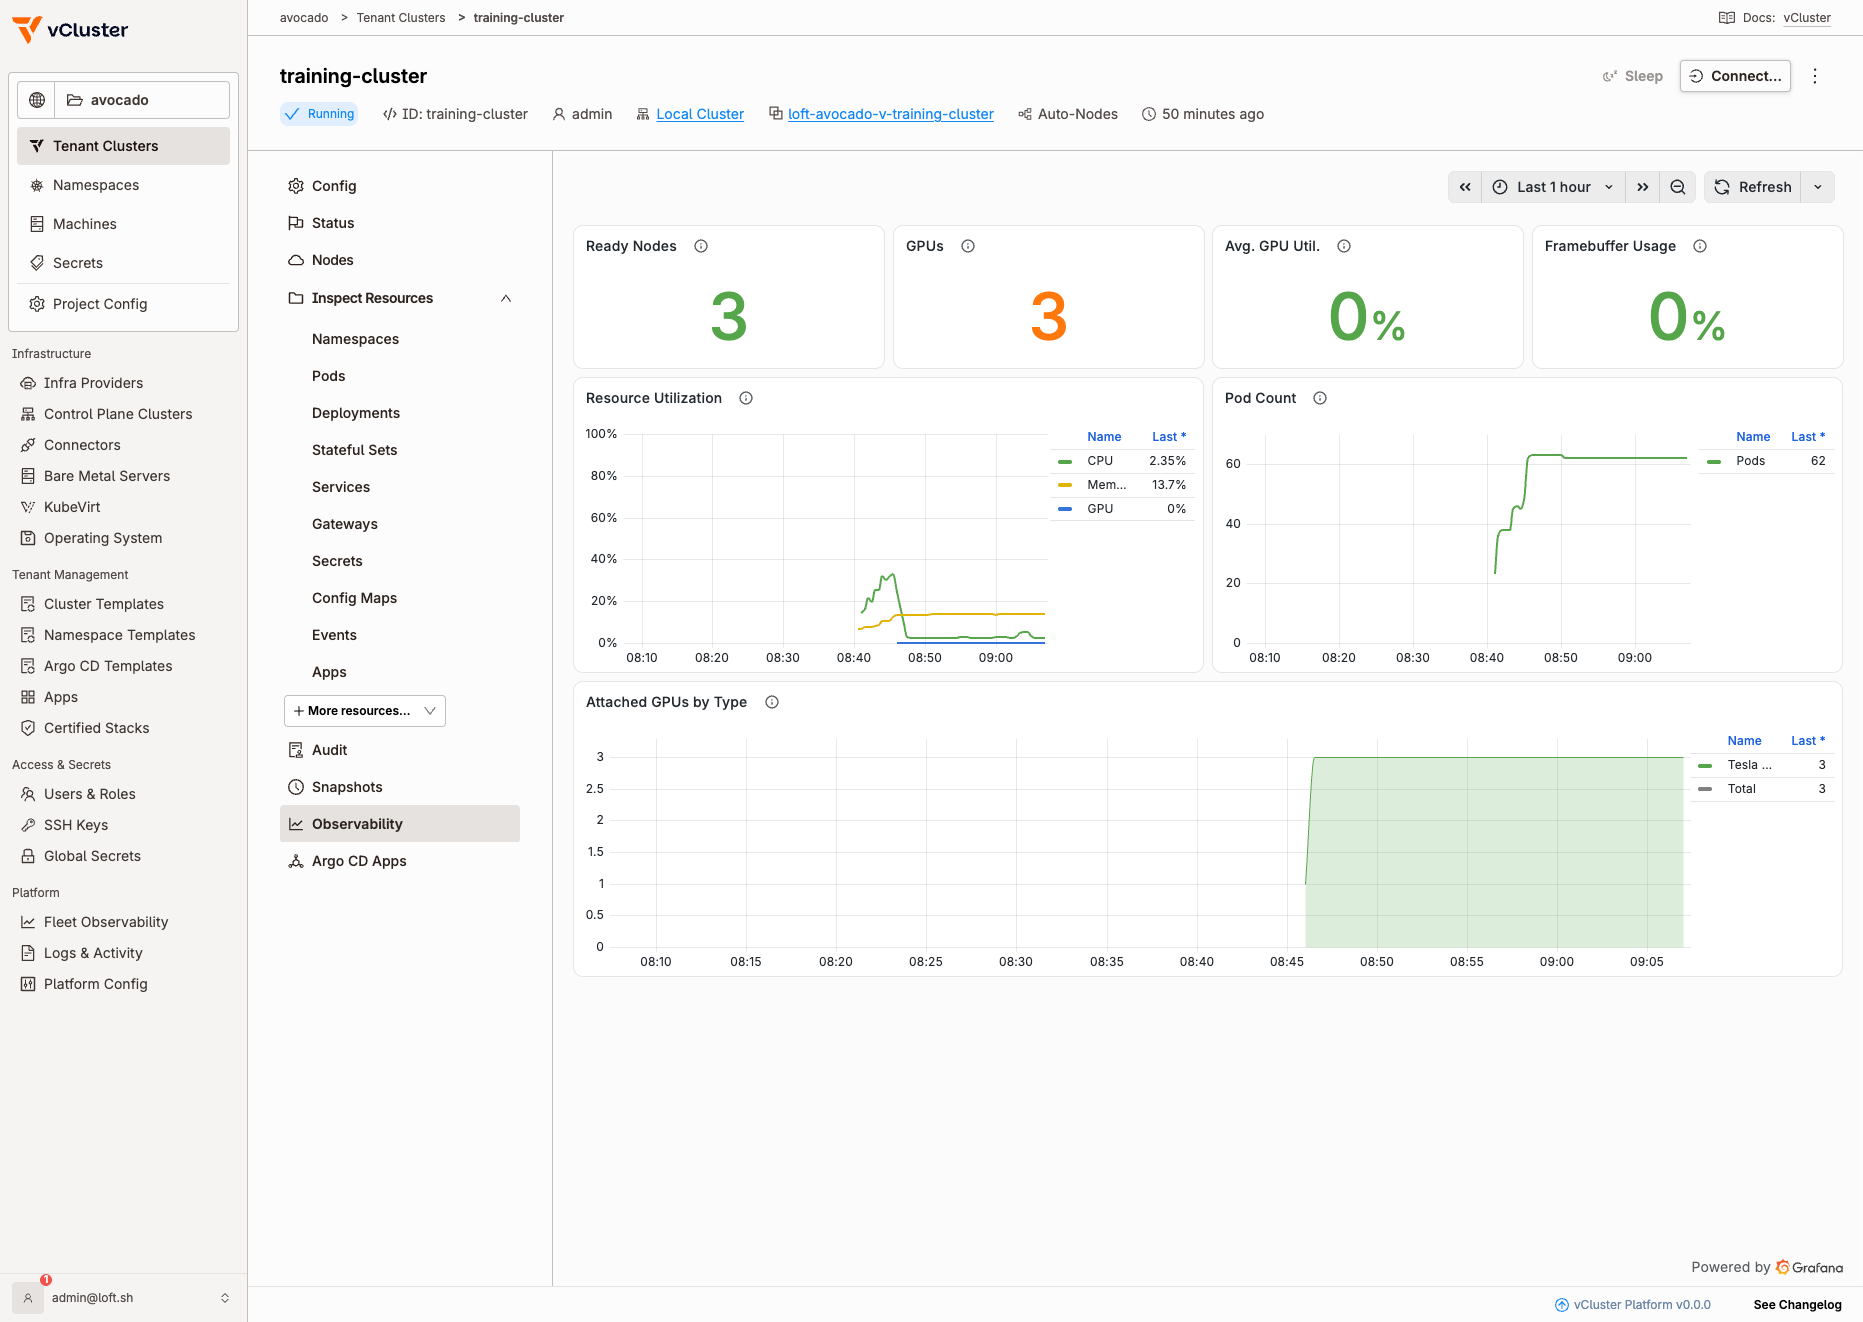
| Cluster Metrics | A single tenant cluster or control plane cluster. Scope comes from the selected datasource, so there are no dashboard filters. |
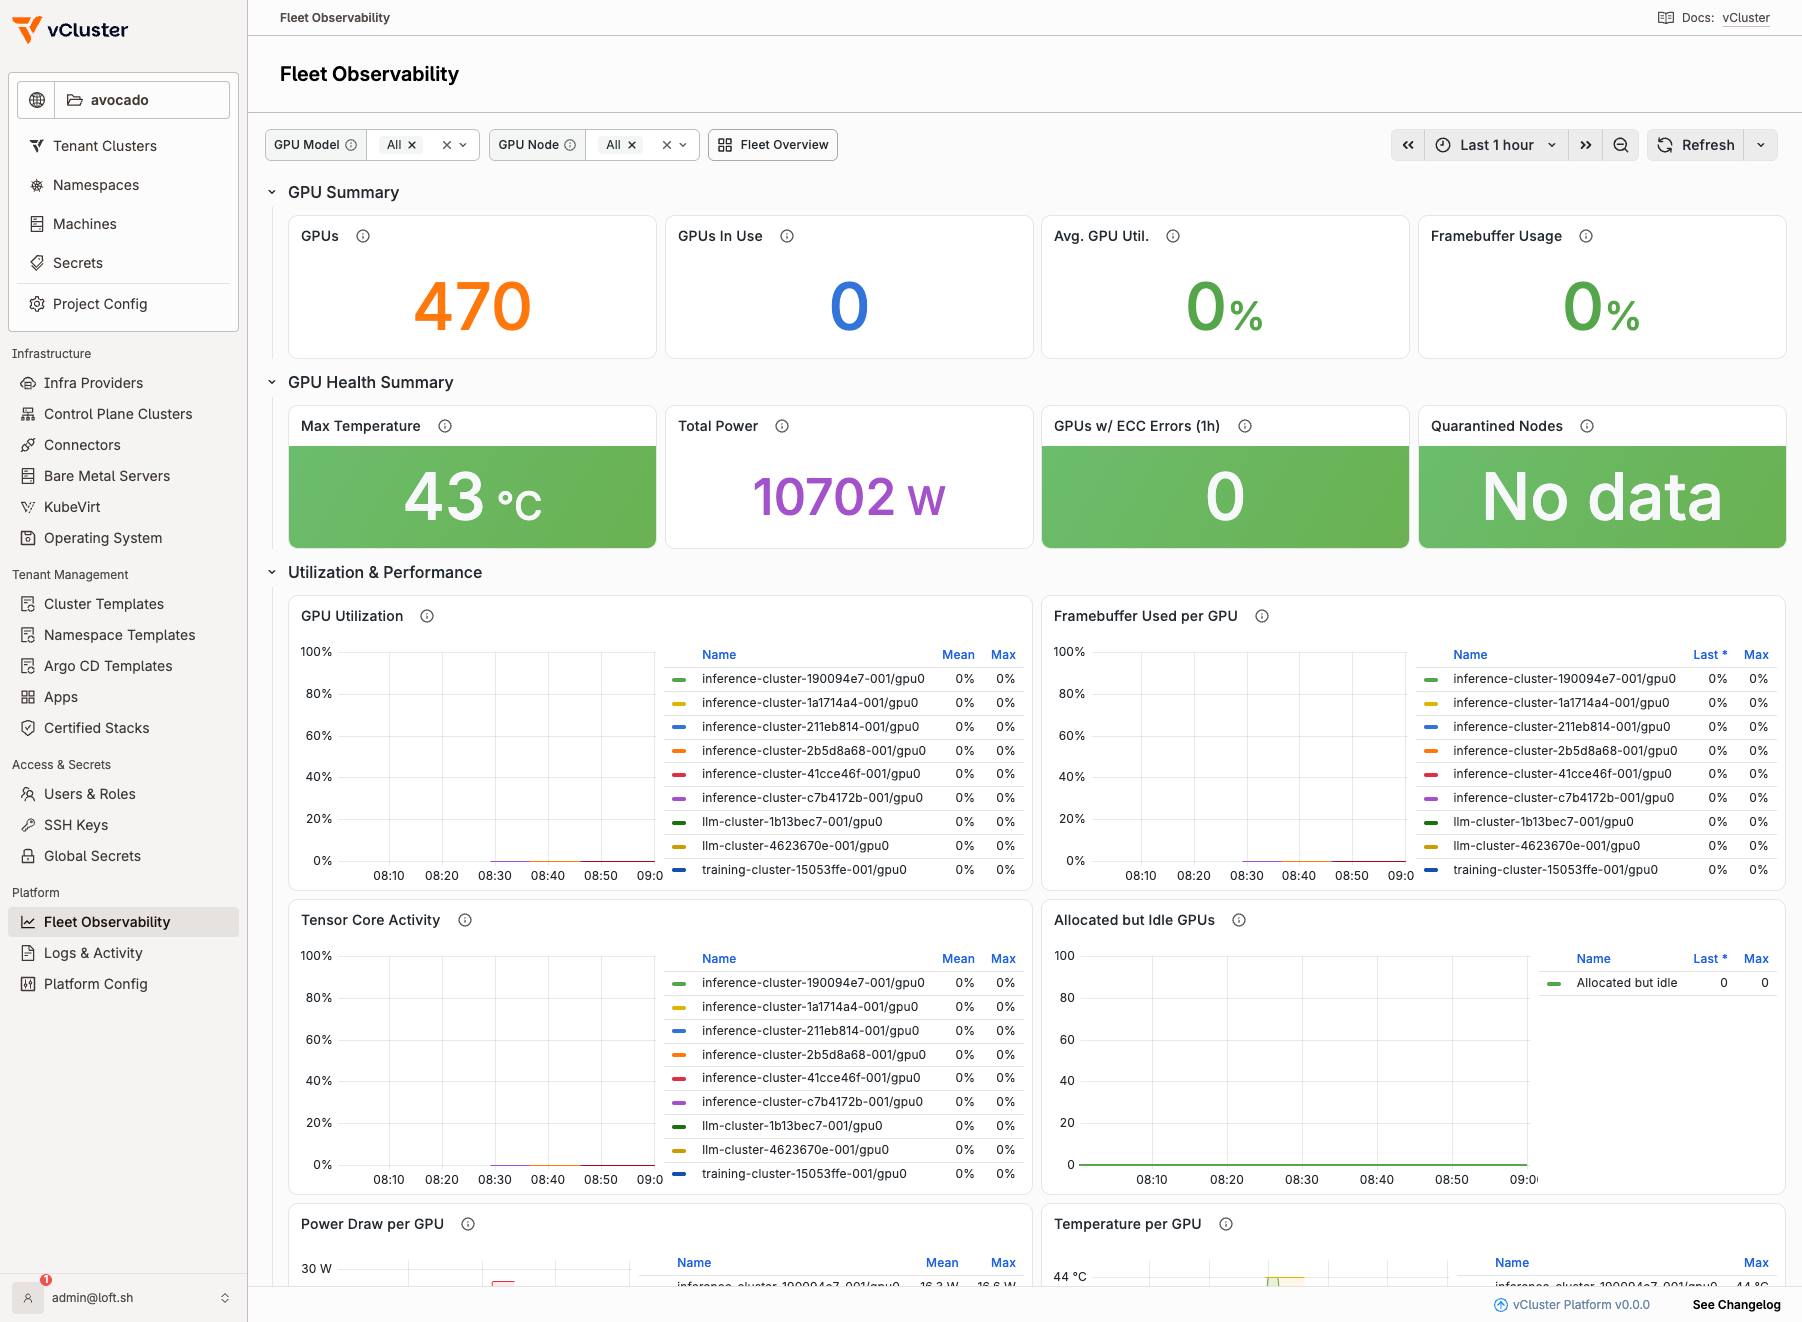
| GPU Overview | GPU fleet view: DCGM utilization, thermals, hardware-error signals, and NVSentinel fault detection. |
Each dashboard has a Datasource dropdown. Pick the datasource for the scope you want to view. The Platform UI also surfaces these dashboards directly: the Fleet Observability page shows the fleet and GPU views, and each tenant cluster's Observability tab shows its scoped Cluster Metrics dashboard.
Datasources and scope
Platform auto-provisions Prometheus datasources that point at the Query Proxy. You don't create them by hand:
- A fleet-wide datasource with no scope headers, for fleet and platform-admin views. Its
UID is derived from the observability connector Secret's
metadata.uid. - A per-tenant-cluster datasource for each tenant cluster, scoped to its project and
instance. Its UID is derived from the tenant cluster's
status.serviceUID. - A per-control-plane-cluster datasource for each control plane cluster.
Tenant cluster datasources inject scope through request headers:
jsonData:
  httpHeaderName1: X-Vcluster-Platform-Project
  httpHeaderName2: X-Vcluster-Platform-Instance
  keepCookies:
    - loft_access_key
secureJsonData:
  httpHeaderValue1: my-project
  httpHeaderValue2: my-vcluster
Control plane cluster datasources set X-Vcluster-Platform-Cluster instead, and the
fleet-wide datasource sets no scope headers.
Authorization with your access key
Every datasource forwards your signed-in Platform access key as the loft_access_key
cookie to the Query Proxy through Grafana's keepCookies setting. This is the session-cookie
path noted in Create a reader key, so
Grafana users don't need a static metrics-reader key.
The Query Proxy authorizes every query as your user, so the datasource you pick can't widen your access. If you select the fleet-wide datasource, you still only get the metrics your access key is allowed to read. Only Platform admins receive fleet-wide results from it.
Endpoint
Query the Query Proxy's HTTP API directly when you automate reads or bring your own query client. Inside the Platform cluster:
https://gateway-fleet-observability.vcluster-platform.svc.cluster.local:8081/api/v1/query
This endpoint assumes the example connector ID fleet-observability. For another ID,
replace the Service name with gateway-<connector-id>.
To connect your own datasource or query client from outside the Platform cluster, expose
the gateway with a LoadBalancer and use its address on port 8081 instead of the in-cluster
Service name:
https://<loadbalancer-address>:8081/api/v1/query
See Expose the gateway with a LoadBalancer
to enable it and retrieve the address. Scope headers and metrics-reader authorization are
unchanged; only the host differs.
The gateway always uses TLS. For the default Platform-managed certificate, read ca.crt
from the gateway-<connector-id>-tls Secret and make it available to your query client. The
examples use its local path through the GATEWAY_CA_FILE environment variable:
CONNECTOR_ID=fleet-observability
kubectl get secret -n vcluster-platform "gateway-$CONNECTOR_ID-tls" -o jsonpath='{.data.ca\.crt}' | base64 -d > /tmp/gateway-ca.crt
export GATEWAY_CA_FILE=/tmp/gateway-ca.crt
Query a tenant cluster
Send a metrics-reader token from
Create a reader key and tenant scope
headers:
curl -G \
  --cacert "$GATEWAY_CA_FILE" \
  -H "Authorization: Bearer $METRICS_READER_TOKEN" \
  -H "X-Vcluster-Platform-Project: my-project" \
  -H "X-Vcluster-Platform-Instance: my-vcluster" \
  --data-urlencode 'query=sum(rate(container_cpu_usage_seconds_total[5m]))' \
  https://gateway-fleet-observability.vcluster-platform.svc.cluster.local:8081/api/v1/query
The Query Proxy injects tenant scope into vector selectors before forwarding the query. The backend receives an equivalent query constrained by:
vcluster_platform_project="my-project",
vcluster_platform_instance="my-vcluster"
Query a control plane cluster
curl -G \
  --cacert "$GATEWAY_CA_FILE" \
  -H "Authorization: Bearer $METRICS_READER_TOKEN" \
  -H "X-Vcluster-Platform-Cluster: local-cluster" \
  --data-urlencode 'query=sum(rate(apiserver_request_total[5m]))' \
  https://gateway-fleet-observability.vcluster-platform.svc.cluster.local:8081/api/v1/query
The backend query is constrained by:
vcluster_platform_cluster="local-cluster"
Use labels in PromQL
You can also include scope labels directly in PromQL. Equality matchers and literal alternation regular expression matchers are allowed on scope-controlling labels.
sum by (vcluster_platform_project, vcluster_platform_instance) (
  rate(container_cpu_usage_seconds_total{
    vcluster_platform_project="my-project",
    vcluster_platform_instance=~"api|worker"
  }[5m])
)
The Query Proxy rejects unsafe scope matchers such as !=, !~, .*, or regexes
that aren't top-level literal alternations. Descriptive labels can use normal PromQL
matchers because they don't drive authorization.
Example queries
CPU by tenant cluster:
sum by (vcluster_platform_project, vcluster_platform_instance) (
  rate(container_cpu_usage_seconds_total[5m])
)
Memory by tenant cluster:
sum by (vcluster_platform_project, vcluster_platform_instance) (
  container_memory_working_set_bytes
)
API request rate by cluster:
sum by (vcluster_platform_cluster, verb) (
  rate(apiserver_request_total[5m])
)
GPU utilization by tenant cluster, when DCGM metrics are collected:
avg by (vcluster_platform_project, vcluster_platform_instance, gpu) (
  DCGM_FI_DEV_GPU_UTIL
)
Query failures
If a query is rejected, check:
- The bearer token has
metrics-readerscope or the signed-in user can read metrics for the requested resource. - The scope headers match the key scope.
- Scope-controlling label matchers use
=or a literal=~alternation. - The Platform API is reachable from the Query Proxy.
For more details, see Troubleshooting.